Monday, July 2, 2012

What I learned from Mr. Mario Singh- Part 2


Pip= what puts money in your pocket . It's the change in value between currencies.

1 Pip= USD $ 10 ( for Standard Lot)

Lot =  size of your trade which depends on your initial capital.

Ex. USD/JPY = 81.50 1 USD= 81.50 JPY

If price rises to 81.51 or greater , BUY (LONG)

If price lowers to 81.49 or lesser, SELL (SHORT)

Fraction Theory:

EUR = 1.350
USD

If EUR increase , BUY(LONG)
If USD increase, SELL (SHORT)

FOREX RULES:


The basis of the above rules should be the general trend of the Graph of the underlying currency pairs. If  the general trend  is Up , we can Buy or Long the currency pair but if its going Down , we need to Sell or Short the currency pair.  The Stop Loss is assigned in order to prevent further losses if you happen to made the wrong choice . The Profit Target is assigned usually twice the Stop Loss to make a profit to loss ratio of  2:1.


Monday, June 25, 2012

What I learned from Mr. Mario Singh about Forex 101

Fear should be defeated by Knowledge to win the game of Forex Trading or any endeavor .
One's desire to change his current plight will enable the Impossible” Earn millions in Forex”
Every loss when learned as a lesson can be a stepping stone to one's success.

Trading one currency against another : Base against Counter Currency

  1. EURUSD - most traded worldwide
  2. USDJPY
  3. GBPUSD
  4. USDCHF
  5. USDCAD
  6. AUDUSD
  7. NZDUSD

Forex is trading 24 hrs x 5 days from Sunday evening to Friday with EurUsd trading more at 8:00 
EST. Forex is  more than 1.4 Trillion USD , much bigger than  NYSE, NASDAQ combined.

Wednesday, May 23, 2012

Forex Basics 101:


In this video Mr. Mario Singh , Asia's Best Forex trainer discussed  the fundamentals  of Forex trading.


Friday, May 18, 2012

FXPRIMUS the Forex Trader's Choice.

Do you know that the highest paid  people on earth are the Wallstreet  ballers  ? Some of them earn as high as 1.5 Billion dollars a year even higher than the highest paid actors and actresses in Hollywood  . Do you want to know how you can start learning the art and science of  Forex trading right at your own place of choice , at your own spare time through the internet? Look no further because FXPRIMUS is here  to help you.

What I like about FXPrimus is the security that they provide to your money .   Even  a new Forex trader  you get a level of trade execution, service quality and fund safety that are normally reserved only for large, sophisticated investors and hedge fund managers. Auditing is important as it protects the public from scams or corrupt business procedures. Undergoing an Audit ensures that your brokerage is using fair policies prescribed by law. Knowing this, you can rest assured that your money is held in safe hands. In order to be the best and earn our trust FXPrimus has been audited by Lancasters Chartered Accountants.

 With FXprimus , you can even open a 60 day practice account within 24 hours , trade virtual  money and  access 40 tutorial videos right away. As soon as you register for  a live account , fund your account for as little as $250 , you'll get 60 days of free 1-on-1 tutorial from a team of experts headed  by world renowned Asia's best Forex Trader Mr. Mario Singh. If you want to know more pls visit this link http://www.FXPRIMUS.com/coach?r=68870

 And for those of you who would like to use automated trading using EA or expert adviser they have the MT4 trading platform. You can also view and copy the trades of expert traders using "Mirror Trader" free with live and practice account. If you want to open a practice account NOW , pls use the link below and save  more   http://www.FXPRIMUS.com/practice-account?r=68870

Exclusive features such as: Live signals and strategies detailed analysis, as well as popular trading tools: charts, indicators, oscillators, rates and market sentiments. With all of these advantages there's no other way but for you to win and if you want more information about the FXPrimus advantages  please visit their website using the complete link below
http://www.FXPRIMUS.com/why-FXPRIMUS?r=68870


'

Tuesday, April 24, 2012

MEG gains 2.82 %

Megaworld  (MEG) gained another 2.82 % today after breaking the previous low of 2.12 and closing at 2.19.

MEG_12Apr2012

Since the beginning of March MEG has been trending up  supported by all technical indicators   MACD, RSI  and volume.

Friday, April 20, 2012

RFM gained 4 %

RFM Foods (RFM)  gained another 4% today 12:00 am and remains  bullish as of said time. As seen on the graph  below:

RFM_20Apr2012_up

All technical indicators from trendline  to volume, RSI, & MACD  show a bullish uptrend .  

Tuesday, March 20, 2012

ION continues its Gain at 2.05 ; ATS ,PHES lower

ION  gained from 1.7 to 2.3 before closing at 2.05 for a gain of  23 %. This 2 days consecutive uptrend maybe attributed to the 100 % dividend planned for shareholders .


ION_16Mar2012_up

As seen on the graph , volume  and technical indicators  momentum, RSI  &  MACD   are all uptrending and should continue for the next few days until a new resistance is formed .

Likewise the same is true for  ATS  Aboitiz Transport Shipping Company .


ATS_16Mar2012_weekly
As seen on the graph , its price has broken above the 2.1 resistance and shall continue to move higher.

Remember to buy only using 2% of your principal to each one as part of good money managament .
Meanwhile , PHES is starting to trend lower and needs to be sold for a nice gain .


Thursday, March 15, 2012

ACE gained more to P11.5 per share, PHES breakout at 0.7

ACE Acesite Hotel  builder of the 1st European indoor  water spa in the Philippines continued its gain from P4 /share since Feb 2  and now at P11.5.


ACE_15Mar2012_up

As seen on the graph all technical indicators  : Simple Moving Average (SMA) , momentum MTM1 and oscillator MACD shows an uptrend and shall continue this trend for now until a stop is decided by the majority of the market makers. 
Meanwhile PHES Phil Estates continue its ascend after breaking the last resistance at 0.7 (this may be seen if you minimize the graph ) and actually broken the top of a Cup and Handle pattern at 0.55 three days ago.
It means a longer uptrend is to be expected for the coming days until the maximum height of the Cup pattern of  approximately 1.01 is achieved.

PHES_15Mar2012_CUP
As always , the trend is our friend if we follow the right strategy . Don't put all your eggs in one basket and be safe .

Thursday, March 8, 2012

PHA gains 7.46 % with a Symmetrical Triangle Breakout

PHA_8Mar2012_up


Premiere Horizon Alliance Corp. (PHA) a Hotel and Leisure company engage in IT gaming and video entertainment  made a 7.46 % breakout today after forming a symmetrical triangle formation during the past week.  As seen on the graph , both the momentum MTM1 and MACD supported by volume  gaining the uptrend . It shall continue to move in this direction until a new resistance is formed.

PHES_8Mar2012

Meanwhile Phil Estates (PHES)  gained 5. 8 % from 0.72 to 0.77 before closing at 0.73  .  A doji candlestick was formed  and may mean a reversal although momentum and MACD both point upward . So anybody need to be careful in buying this trend.

Friday, March 2, 2012

Unioil Cup and Handle Breakout 14.29%

As predicted  last week ,Unioil (UNI)  started its ascent  from almost two weeks of  consolidation and made a huge gain yesterday of 14.29 %  from 0.29 to 0.34 before closing at 0.32 .

UNI_1Mar12_Breakout
As seen on the graph . volume ,  momentum MTM1  & MACD histogram  suggest a continuation of the bullish pattern moving up on its 2nd day today .

OPM_1Mar12_Up

Another one that made a comeback is Oriental Petroleum (OPM)   . All indicators : volume ,MTM1 & MACD points to continuing trend today.

Have a safe weekend !


Friday, February 24, 2012

The Case of Cup & Handle Breakout : MHC (37 % Gain)

Mabuhay Holdings Corp (MHI)  is a case of  the Cup and Handle breakout which today gained 37.93 % from  P 0.60 to P 0.80 per share.  As seen from Chart below

MHC_24Feb2012_Breakout

From Feb.8-22 , MHC went down as seen on the graph as the Red  candlesticks while  temporarily on consolidation , the following day Feb 23 a Green candlestick appeared which is followed by the breakout today. One characteristic of  a C&H breakout is the height measured from the top handle to bottom of the Cup is the max. range  which turn out to be about  P1.0 per share.  It's best to buy this just before the breakout following the rule "Buy Low , Sell High"  to maximize your Return on Investment. As previously discussed before , possible scenario may happen again on Unioil and Ever stocks anytime next week .

 As always , it's best to study & plan everything before you enter any trade.

Have a nice weekend !


Taking a Closer Look at IRC (50 % Gain)

I just discovered a  better way to look at rising stocks  while its ongoing  rather than look at a stationary chart . If you select "5 min"  instead of the default "Daily " chart display on top menu of  Citiseconline  technical chart then you'll be able to see better and make an intelligent decision to your entry and exit price.

As shown below is the 5 minute chart of the days topnother IRC Properties with an impressive 50% gain from P1.2 to P 1.8 per share .

IRC_24Feb2012_Breakout
If you notice the price increase slow but steadily above the 12 day Simple Moving Average until it reach the peak of 1.8 where it close. Both the momentum MTM1 and MACD support the bullish signal.

I do not recommend buying the stock at this time but if you do , select a lower price so that you'll have an allowance in case the uptrend  reverses. Or if you bought early target a max of 20 % gain  before selling  to keep your profit in place . Always keep a "Trailing Stop Loss" value when entering a trade , lets say 2 % of your buy price and if the price goes the other way then you always keep your profit intact .

Invest Safely and have fun !

Thursday, February 23, 2012

OPM, OV, VUL Sell-off ! CMT, SMDC Rise!

All of the mining companies mentioned above  sold-off today and lost a lot if you were not able to sell in time. These were overextended stocks  that is due for profit taking ;

OV_23Febn2012_Down

OPM_23Feb2012_Down


As shown on the graphs the last  Red Candlestick  engulfs the previous  Green  candlestick  which  signifies  a   downtrend  and  supported by the downward pointing momentum MTM1 but not so obvious with MACD.

On the other hand, some of the Bullish stocks today includes CMT, PHA,  & SMDC.  As shown below CMT has broken its resistance of 1.8 and is on an uptrend , supported by momentum and MACD .


While SMDC continues its slow  but sure uptrend   4 days  in a row as supported by the momentum MTM1 & MACD indicators.


Wednesday, February 22, 2012

OPM , OV gained higher !

Oriental Petroleum & Mineral  (OPM) gained another 19.23 % from 0.027 to 0.032 before closing at 0.031 per share. The fourth highest gain for the day .

OPM_22Feb2012
Since it already broke above the resistance of 0.029, and with the bullish upward trend shown by the volume, MTM1 & MACD , we expect this trend to continue.

Likewise , Philodrill Corp (OV)an oil, gas and mineral exploration and development company gained another 14.58 % from 0.048 to 0.055. Since it already broke above the resistance of 0.030 the previous day and with the bullish uptrend by Volume, MTM1 & MACD  we expect this trend to continue  until the market maker starts selling , so be cautious .

OV_22Feb2012 
Other stocks on uptrend are EEI, MEG , SMDC .


Have fun investing !


Anatomy of a Breakout: RCM (30.71%), VUL (15.84%)

Republic Cement Corp. (RCM) made an impressive 30.71% gain today  from 6.3 closing at 8.3 per share after consolidating for less than  two months (10 Jan to 21 Feb). As shown in the Graph below:

RCM_22Feb2012_Breakout

The next one is Vulcan Industrial and Mining (VUL) with a gain of 15.84 % from 1.020 to 1.170 per share  after consolidating from 11 Jan to 21 Feb.  On both cases the price stays almost the same throughout the period of  hybernation , momentum MTM 1 occasionally goes a little above the zero line while the MACD stays above the zero line, with histogram a little on the negative and occasionally on positive side. Note that the 32 day Simple Moving Average (SMA) crossed the 12 day SMA on the day of breakout (after temporary separation during consolidation).  The upcoming breakout signal  is shown with a green arrow pointing up on the MACD a week before the event.

VUL_22Feb2012_Breakout
I do not recommend buying such stocks unless there's an increase volume , uptrending momentum MTM1 , & positive MACD bullish signal .

Thursday, February 16, 2012

Another Lesson Learned from GEO , NI & BHI

A lot of traders  have been disappointed today after GEO, NI, BHI lost  up to 5 -8 % each.  Today we learned another lesson  " Don't trade Overextended stock".  What is an overextended stock? As explained by Mr Tom Willard   is shown on the picture below:

Overextended_Stock

When the stock price moves too far from the EMA or SMA line and the slope becomes too steep , the stock is said to be Overextended .  And when this happens its too risky to trade and one needs to be very cautious  not to add more to his current trade. If you have stocks like this , its better to sell while its high . A very good example  below is GEO

GEO_overextended
GEO together with BHI , NI , DIZ lost for 2 consecutive days after the profit taking  of the big traders.

Here is another one that lost  BHI .

BHI_Overextended
Remember the Lessons : Be safe & Follow the strategy for  Happy investing !

WIN still a winner with 9.8 % gain on Descending Triangle Pattern!


Wellex Industries (WIN) made a huge gain of  9.8 %  from 4.8 to 5.3 after forming a descending triangle pattern for 1 week which is a reversal pattern  as shown below. Likewise the momentum shows an uptrend.

WIN_16Feb2012_up


Meanwhile ,Ever Gotesco gained 3.45 % today after loosing 9 % the previous day. A doji , a flat candlestick  appeared today at the close and hopefully the start of more gains at the end of the Cup's Handle .

EVER_16Feb2012
Likewise Megaworld (MEG) formed the same Doji and is meant for reversal as shown in the momentum MTM1 and MACD graph  below.

MEG_16Feb2012
Most of the mining companies , GEO, NI, DIZ  lost for the 2nd consecutive day . Only Manila Mining remains unchanged and on uptrend.

Have a safe & happy investing ! Remember don't put all your eggs in one basket and don't overtrade.


Monday, February 13, 2012

Geo gained another 19.1%

Geo Resources (GEO) a small mining company is one of the best performers yesterday  with a gain of 19.1 % , opening at 0.9 and closing at 1.06 per share.

GEO_13Feb2012_up
Looking at the chart , a huge volume 262 M , Momentum MTM1 , & MACD  blue lines on top of orange lines indicate a continuing bullish trend tomorrow.

Another real estate company gaining momentum is Boulevard Holdings Inc. ( BHI) with a 8.49% gain .


It just broke above the 1.0 resistance line and should continue its bullish stance as shown by the volume, MTM1 & MACD  signals all pointing upwards.

Happy Investing !


Friday, February 10, 2012

Market Recovered : Manila Mining Gained 5.56%

The PSE market bulls won this time with 13.9% gain and Manila Mining likewise increase by 5.56 % with 2.6 Billion shares traded.

MA_10Feb2012-up
With Momentum MTM1 just above the zero line , investors need caution although the green candlestick and both MTM 1 & RSI  are both pointing up shows a bullish signal.

Also , Unioil and Ever both gained 4.62% and 4.42 % respectively recovering my paper loss in steps. With Ever forming a Cup and Handle formation , we expect these stocks to gain more in the coming days.

Ever_10Feb2012_up

Uni_10Feb2012_up
With both the Momentum and MACD showing blue lines on top of  orange lines , we expect the bullish trend to continue until  next week.

Have a nice weekend  & Happy Investing !


Thursday, February 9, 2012

Market is Down for a While!

I was wrong with my expectation on Ever and Unioil this time ,  the opposite happened they moved lower but I think this is only temporary as part of the volatile market cycle. As long as we have the stock price above the 10, 20,50,100 day Simple Moving Averages   then it's still  possible that this will eventually go up and we win in the end. That's why it's important to have extra money at all times-  follow proper money management  and use only a portion of available money in each stock that you buy. As the saying goes "Don't put all your eggs in one basket"

UNI_9Feb2012_down
On the other hand , Nihao and ANI continues their nice  ascent . I expect they will even in bad market cycle unless they're hit by bad publicity.

NI_9Feb2012_Up


Wednesday, February 8, 2012

Ever gained 11.32% with 165M shares

Ever Gotesco  gained a huge volume jump  today with 165 M shares traded , opening at 0.280 and finally closing at 0.295. Expect this trend to continue  as  shown below:

EVER_8Feb2012


With the MACD  blue line on top of orange line  and with the On-Balance Volume increasing and pointing up , both signifies up trend to continue.  


If you zoom out the graph you will see that Ever is forming a huge Cup and Handle formation which is a bullish indication . If you want to learn more about this pls see 


http://stockcharts.com/school/doku.php?id=chart_school:chart_analysis:chart_patterns:cup_with_handle_cont


Ever _10Feb2012


As always its not my recommendation to buy  this stock (this is not for the faint of heart because of the temporary downward movement in price)  , invest at your own risk.


Happy Investing !


Unioil Gained 10.45% today

Unioil  which opened at 0.34 , went up to 0.42 and finally closing at 0.37 for a gain of 10.45 % in one day .If you bought P5000 of Unioil shares you could have 14700 shares , gaining  P 1470  if you sold at 0.42.

UNI_8Feb2012


Meanwhile Manila Mining gained 2.78% , from 0.72 to 0.74  signifying a bullish signal   after two days of pullback.  I will try to buy MA tomorrow at around 0.72.


Happy Investing !

Nihao -Signs of Trending Stocks to Buy

Nihao Mineral Resources (NI) is a good example of up trending stock whose value will increase as long as it doesn't hit by outside forces . Such forces would be bad publicity that made investors loss interest on the stock causing a sudden selling and volume decrease producing a large Red candlestick.  As shown in the graph below Nihao is a definite buy.

NI_8Feb2012


If  you enabled the Simple Moving Average Lines from the buttons on top : 32(Blk) , 65(pink) , and 130 (blue) and they cross below the current price  moving up you will see that the momentum started from Nov. 2011 although it only became more obvious from Jan 13, 2012 because of the steep slope.

Meanwhile , Boulevard Holdings (BHI) is an example of  a Range  or  Sideways non- trending stock. As shown in the graph the price is below the 130 day (blue)  Simple Moving Average (SMA). Such stock price doesn't go up for the near term but stays on very limited range for several weeks to several months tying up your capital. So its best to sell it and instead only buy trending stocks for long term investments .Unless you see that the 12 day SMA crosses above  the 32 day SMA which indicates a bullish trend  I suggest to keep away from such stocks.

BHI_8Feb2012_Sideways


Tuesday, February 7, 2012

Mabuhay Holdings gained another 7%

Today Mabuhay holdings gained another 7 % while most of the market went down  , from 0.60 at opening then closing at 0.7 as seen on the graph

MHC_7Feb2012
The volume significantly increase to more than 27 million on its ascent , momentum  MTM1 continues  while the MACD remains bullish with blue line on top of orange line. This is still a buy at 0.66 and sell when a bearish signal appears .

Another stock on its way up is  Unioil Resources and Holdings (UNI) which I'll try to buy around 0.31 at the opening.  

UNI_7Feb2012
Meanwhile, while a lot of big company stocks lost after a good start including GMA7 , AGI , RCBC etc.Nihao (NI) remains bullish with more than 11.76 % gain from 9.03 to 10.06 . I'll try to buy NI at 9.2 at the open.

Happy Investing !

Monday, February 6, 2012

Selling Manila Mining for a 13.5 % Gain

Today  I decided to sell my shares on Manila Mining (which I bought at 0.065 last week)  at 0.077  , due to bearish  signal on the graph  as seen below :

MA_6Feb2012
It's called the engulfing candlestick pattern wherein a larger red bearish candlestick on rightmost top overshadows the smaller green candlestick which signifies a down trend. Also  the Momentum MTM1 shows the orange line on top of blue line while a Red arrow pointing down is shown on RSI at bottom.

Meanwhile , Wellex Industries gained most of its lost a week ago rising to 20 %  from 0.47 to 0.57.  This only proves that a trend reversal may take 1 week .

WIN_6Feb2012

Mabuhay Holdings Corp. gained 8.3 % today , from a low of 0.57 -0.6 to a maximum 0.7 before going back to 0.65. We should hold this until we see a bearish signal.

MHC_6Feb2012


Sunday, February 5, 2012

Mabuhay Holdings on the Run at 22.45 %!

Last Friday one of the top performers was Mabuhay Holdings Corp. (MHC)  gained 22.45 %  from a low of 0.5 to a high of  0.62 , closing at 0.60 . Looking at the chart below ,

MHC_5Feb2012

With the Momentum (MTM1) pointing up and the MACD  blue line on top of the orange line going positive,  this trend  seems to continue until the resistance around 0.8 ( seen when the graph is slightly minimize and a horizontal line is projected back touching the peaks and throws of the graph ). You may try to buy MHC around 0.55 .

Meanwhile following a good news  about its partnership with Fox International ,  GMA7 continues its ascent  from 8.26 to 9.62 , a gain of 17.03 % after a week of  consolidation. In same reason as above , we expect this trend to continue  as shown on the graph until around 9.7 - 10 resistance lines.

GMA7_5Feb2012
Also mining companies Manila Mining , and Nihao continues the up trend . You may also buy RCBC and ANI  both showing up trend.

Good Luck on your investments!


Friday, February 3, 2012

Pinoy Money Talk- a Good Site for Investors

Today I just found a good site for every investors or entrepreneurs interested in investing their hard earned money .  One of the best things to do if you have some money to invest is buy this high-yield dividend stocks.
They also have Forum to share information and ask questions all about money and investing.

http://www.pinoymoneytalk.com/top-10-stocks-with-high-dividend-yield/

Using 20-30% of your investable funds while the rest may be use for buying up trending stocks using my blog as  a guide.  Just be sure to diversify and invest only 5% to each stock up to maximum of  3 stocks to start with and follow good money management.

 As Warren buffet said " Never loose money "  and Rule 2  is "Follow Rule # 1"

And I would say " Let your winners run and cut your looses short"


Have fun investing and growing your money by learning !

A Lesson Learned - Follow the Strategy !


I was too excited and didn't notice that the trend was not recovering from the bottom  i bought more stocks expecting that it will go higher because of  a Doji  (+ signal) which might means a reversal . However the next day everything turned bearish just because I didn't follow my strategy by the number.  Wellex Industries  is not a winner this time, I just gave back some of  my winnings with a paper loss . Next time I will stick to these startegies:

1. To see a Green candlestick above the 12 day simple moving average (SMA)
2. The Momentum MTM1 should be positive, moving up or above the zero line.
3. The MACD should be positive moving up, blue line on top of orange line.

Win_3Feb2012_down
Meanwhile, Manila Mining continues to be a winner gaining another 2.7% from 0.072 yesterday up to max. of 0.078 today.  My investment gained 16.5 % only for Manila Mining.

MA_3Feb2012_Up
Also. GMA7 gained 4.7 % from 8.2 to P8.55 per share.

Don't forget to have a diary of  what happened on your trading so that the lessons remain . Have  a nice weekend . Happy investing !


Monday, January 30, 2012

You're P5000 could have earned 11.9 % with Manila Mining today!

What if you can predict  the future price of a stock as a weatherman predicts the weather  for the next 24 hours ?  What if you know that the stock price will rise and you bought at a lower price before? If  you knew 90% that  you're on the winning side , will you bet your savings? By knowing simplified technical analysis- this time you're luck is in your own hands .  This is much better than  the casino , where the odds of winning is 30 % to none  and where luck is mostly on the hands of the casino owner .

Last Friday , I mentioned that Manila Mining is on the way up  and today Monday, it did rise 2.86 % while the most of the stock market fell today. As shown on the graph below

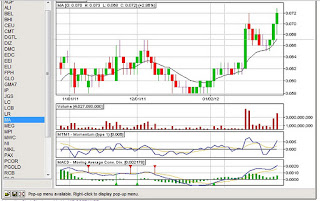
MA_30Jan2012

Manila Mining is forming a "Cup and Handle figure " which means it's still on the way up until it meets some resistance from this time onwards. Today , It's price rose from Friday's 0.067 to 0.074 which means if you have invested just P5000  you can buy 74600 shares and today earned  P596.8 which is  11.9 % Return on Investment. So for those who have followed this blog keep invested until  a red signal to sell shows up on the MACD and the Momentum MTM1 is moving downwards and  before crossing the zero line.

Good Luck and Happy Investing !